Tutorial 3: Orientation 3D (Arduino)
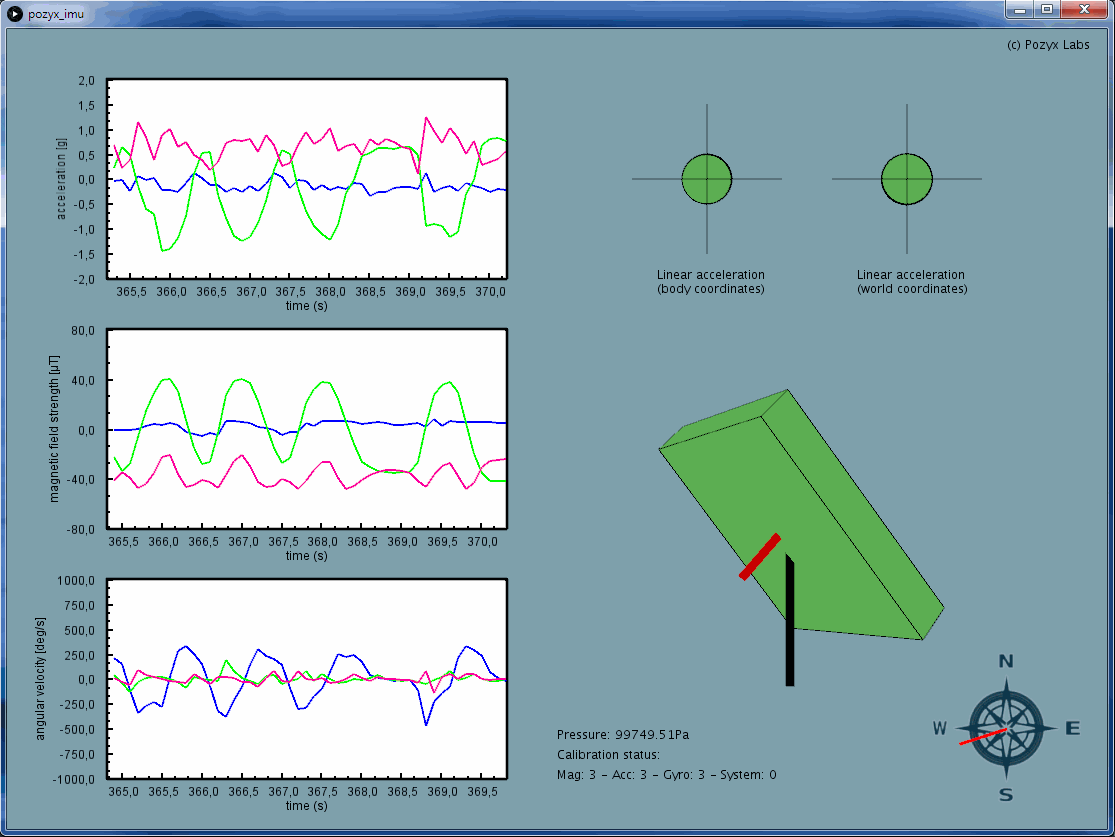
In this example, the sensor data is read from the Pozyx developer tag (either the tag mounted on the Arduino, or a remote tag). To visualize all the data, we use Processing. Below a screenshot of the Processing program showing all the sensor data graphically. This example requires one or two Pozyx developer tags and one Arduino.
Install Processing
In order to run the sketch in Processing, a specific version of the program is required. Processing version 3.1.1 can be found on this Github page https://github.com/processing/processing/releases/tag/processing-0250-3.1.1. Simply download the correct folder that corresponds to your system and extract the files. Within the folder there should be an executable called processing.exe that you can double click to run the program.
The sketch also requires two libraries that can be downloaded here. Download the two folders and place them into the libraries folder linked to Processing. This folder can normally be found under Users > Username > Documents > Processing > libraries. It is important that you copy paste these two exact libraries instead of installing them using the tool in the Processing application.
As a final step the examples can be downloaded here. The pozyx_orientation3D folder contains the necessary sketch. Place the folder in the Processing examples folder that can normally be found under Username > Documents > Processing > examples
Usage
Open up the orientation 3D example in the Arduino IDE under File > Examples > Pozyx > orientation_3D and upload it to the Arduino
Now open up the pozyx_orientation3D.pde sketch in Processing
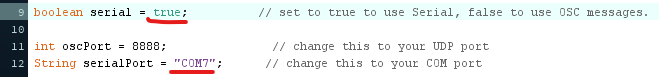
In Processing, make sure serial is set to true, and that your serialPort matches the one used by your Arduino.
If you run the pozyx_orientation3D.pde sketch in Processing, you should be able to physically rotate your Pozyx tag now and directly see it rotate in Processing as well. There are plots on the side and at the top, but what do they all mean?
Understanding the sensor data
Acceleration (g): the acceleration is measured along 3 axes (i.e., in 3 directions) which is shown by three different colors on the plot. The acceleration is expressed in g's (from gravity). 1g is exactly the acceleration from earth's gravitation pull (1g = 9.81m/s2). Because the acceleration from gravity is always present and equal to 1g it can be used to determine how the device is tilted or pitched. Try rotating the Pozyx device by 90 degrees (slowly) and you will see the the acceleration change from one axis to the other.
Magnetic field strength (µT): the magnetic field strength is also measured along 3 axes and is expressed in µT. It can be used to measure the earth's magnetic field which varies between 30 and 60µT over the earth's surface. The measured magnetic field strength can be used to estimate the magnetic north (similar to a compass). However, magnetic fields exist wherever electric current flows or magnetic materials are present. Because of this, they will influence the sensor data and it will become impossible to determine the magnetic north exactly. Try holding a magnet or something iron close to the Pozyx device and you will see the magnetic field strength fluctuate.
Angular velocity (deg/s): The angular velocity is measured by the gyroscope and measures how fast the device rotates around itself. By integrating the angular velocity it is possible to obtain the angles of the device. However, due to drift this method does not give accurate results for a prolonged time. What is drift you wonder? Well if the device is standing still, the angular velocity should be exactly equal to zero. This is not the case however, it will be slightly different and this error will accumulate over time when integrating to angles.
3D Orientation: The 3D orientation is shown by the 3D model in the middle. The orientation is computed by combining the sensor data from all three sensors together. By combining all sensors it is possible to overcome the limitations of each sensor separately. The 3D orientation can be expressed in Euler angles: yaw, pitch, roll or in quaternions. Quaternions are a mathematical representation using 4 numbers. In many situations, quaternions are preferred because they do not have singularity problems like the Euler angles.
Gravity vector (g): If the Pozyx device is standing still, the acceleration is exactly equal to the gravity. The gravity vector is shown by the black line and is always pointing down. Notice that even when moving the device (which introduces an additional acceleration) the gravity vector still points down. This is due to the fusion algorithm that can separate gravity from an arbitrary acceleration;
Linear acceleration in body coordinates (g): The linear acceleration is the acceleration that remains after the gravity has been removed. When you hold the device horizontal, pointed forward, and shake it from left to right the circle will also move from left to right in the plot. However, if you rotate the device by 90 degrees and shake it again from left to right, the circle will now move in a different direction. This is because the linear acceleration is expressed in body coordinates, i.e., relative to the device. Note that all the above sensor data is expressed in body coordinates.
Linear acceleration in world coordinates (g): Once the orientation of the device is known, it is possible to express the acceleration in world coordinates. By doing this, the rotation of the device no longer affects the linear acceleration in the plot.
The code explained
We'll now go over the code that's needed to retrieve all sensor data. Looking at the code's parameters, we can see that we can once again use a remote Pozyx tag for this. This means that you could for example attach a Pozyx tag to a ball, and watch the ball's spin directly on your screen as well with the Pozyx tag.
Imports and setup
The imports are the default Pozyx library imports and Wire.h for the I²C functionality encountered in the previous tutorials.
The Pozyx and serial connection are then initialized, and the last measured time is set.
#include <Pozyx.h>
#include <Pozyx_definitions.h>
#include <Wire.h>

void setup()
{
  Serial.begin(115200);
  if(Pozyx.begin(false, MODE_INTERRUPT, POZYX_INT_MASK_IMU) == POZYX_FAILURE){
    Serial.println("ERROR: Unable to connect to POZYX shield");
    Serial.println("Reset required");
    delay(100);
    abort();
  }
  if(!remote)
    remote_id = NULL;
  last_millis = millis();
  delay(10);
}
Loop
The main loop deserves to be elaborated on. The Pozyx's IMU sensors trigger an interrupt flag when there is new data available, and in the code we wait for this flag to trigger explicitly.
When it does, or when we read the sensor data remotely, the code will read out all sensor data and it's calibration status from the (remote) Pozyx, and then print it serially as comma separated values, which will be converted to standard units and interpreted by Processing. This is done in getAllRawSensorData, where the sensor registers are read directly and their values are stored in a sensor_raw_t struct. There is also a getAllSensorData function available, where this raw sensor data gets converted to standard units and is stored in a sensor_data_t struct, but we choose the former because we prefer this conversion to be done in Processing, on a powerful CPU, offsetting the Arduino's processing and allowing a faster retrieval rate of this IMU data.
When it doesn't, it tries again.
void loop(){
  sensor_raw_t sensor_raw;
  uint8_t calibration_status = 0;
  int dt;
  int status;
  if(remote){
     status = Pozyx.getRawSensorData(&sensor_raw, remote_id);
     status &= Pozyx.getCalibrationStatus(&calibration_status, remote_id);
    if(status != POZYX_SUCCESS){
      return;
    }
  }else{
    if (Pozyx.waitForFlag(POZYX_INT_STATUS_IMU, 10)){
      Pozyx.getRawSensorData(&sensor_raw);
      Pozyx.getCalibrationStatus(&calibration_status);
    }else{
      uint8_t interrupt_status = 0;
      Pozyx.getInterruptStatus(&interrupt_status);
      return;
    }
  }
  dt = millis() - last_millis;
  last_millis += dt;
  // print time difference between last measurement in ms, sensor data, and calibration data
  Serial.print(dt, DEC);
  Serial.print(",");
  printRawSensorData(sensor_raw);
  Serial.print(",");
  // will be zeros for remote devices as unavailable remotely.
  printCalibrationStatus(calibration_status);
  Serial.println();
}
The calibration status gives information about the quality of the sensor orientation data. When the system is not fully calibrated, the orientation estimation can be bad. The calibration status is a 8-bit variable where every 2 bits represent a different piece of calibration info.
What's next?
You're at the end of the standard tutorials that introduce you to all of Pozyx's basic functionality: ranging, positioning, and its IMU. If you haven't already done so and have the number of devices necessary, you can read the multitag tutorial. When you start work on your own prototype, don't be afraid to delve into our documentation which should suffice for all your needs.
There's also the chat room tutorial, for which you will need two Arduinos and two Pozyx tags, in which you will build a small chat room where you use Pozyx to communicate between two computers. This opens the door to adding real communication and control to two Arduino-enabled Pozyx tags, as you can send and interpret Arduino commands this way as well.