Layers
The layers toolbar can be accessed by pressing the layers icon in the bottom right corner:

It lets you completely customize your visualization by hiding or showing certain parts of it. The options are divided into 4 groups which can be enabled or disabled with a single toggle. The visualization options within the groups can be activated or deactivated by clicking on them. A visualization option that is enabled is blue, a disabled option is colored grey. The groups and options are briefly discussed below.
Tags
This group contains all the visualization options for the tags.
Height
You can show the height of your tags on the visualization (= the z-coordinate) by enabling the Height layer.
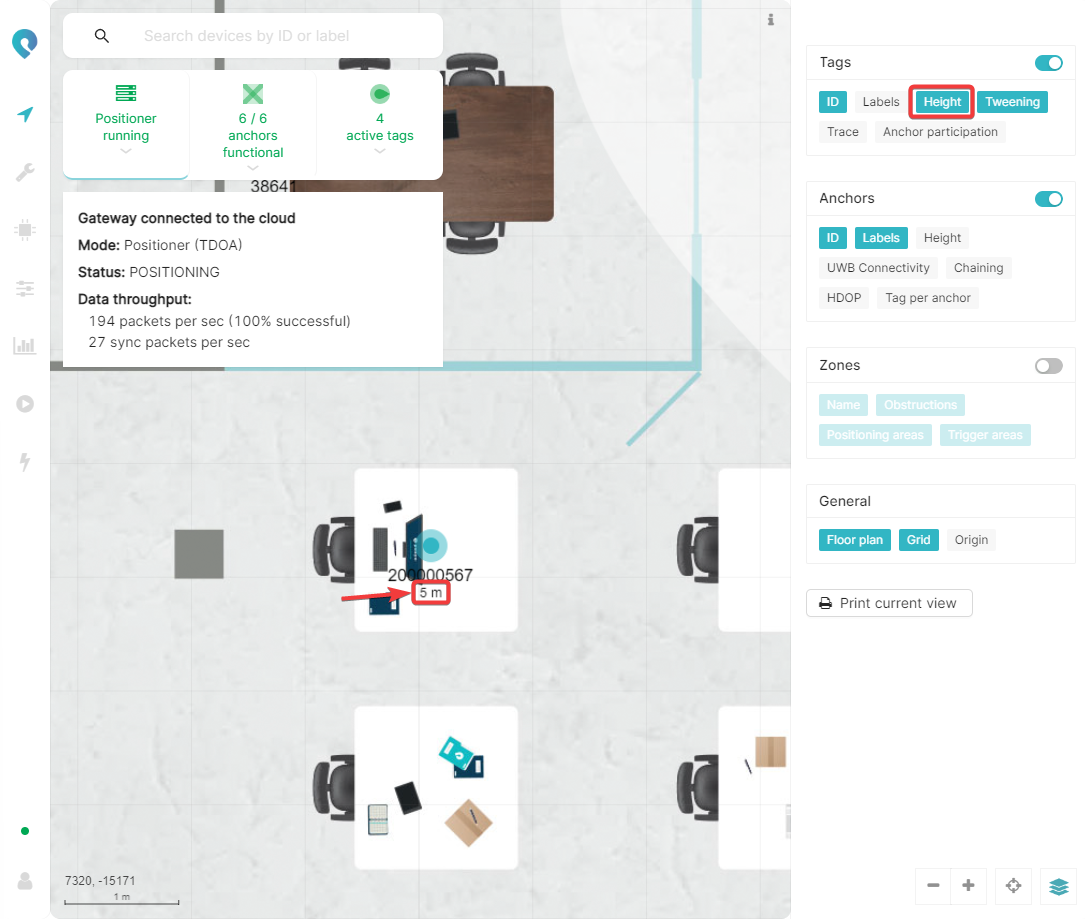
This is only really useful if you have a 3D system. If you have a 2.5D system then this will just show the height that you’ve set your tags to in the positioning settings.
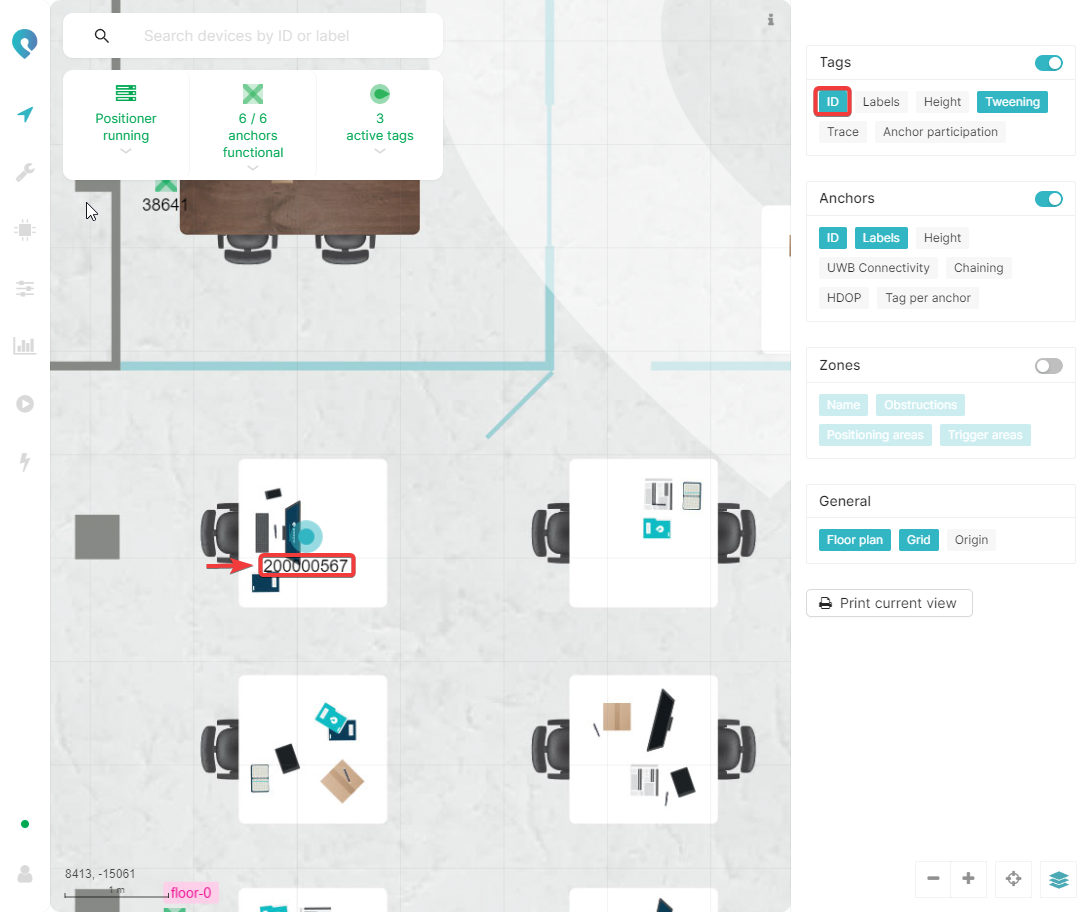
ID
You can show the tag ID by enabling the ID layer.
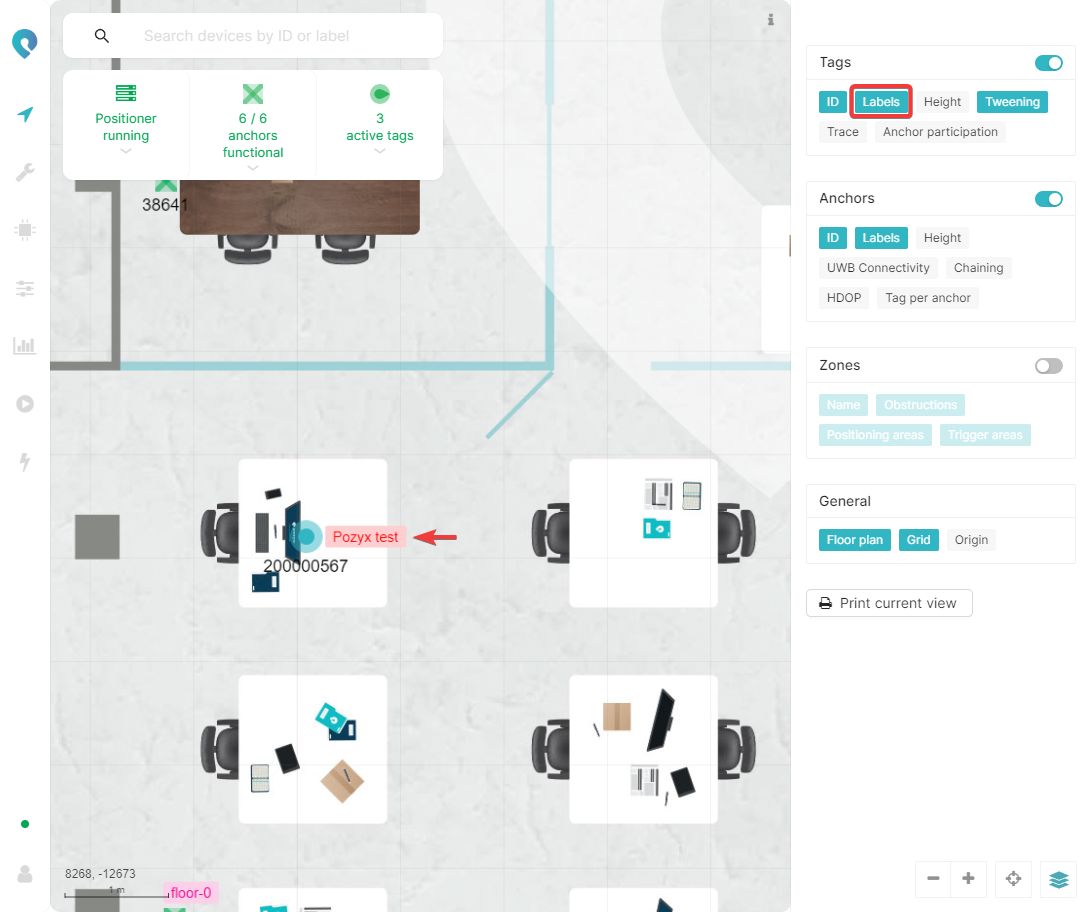
Labels
You can show the labels assigned to the tag by enabling the Labels layer
Tweening
Tweening can be enabled with the Tweening layer. This layer smoothens the display of the tag movement in the visualization
Trace
For moving tags, a trace can be enabled that visualizes the previous positions of the tag. This can be done with the Trace layer.
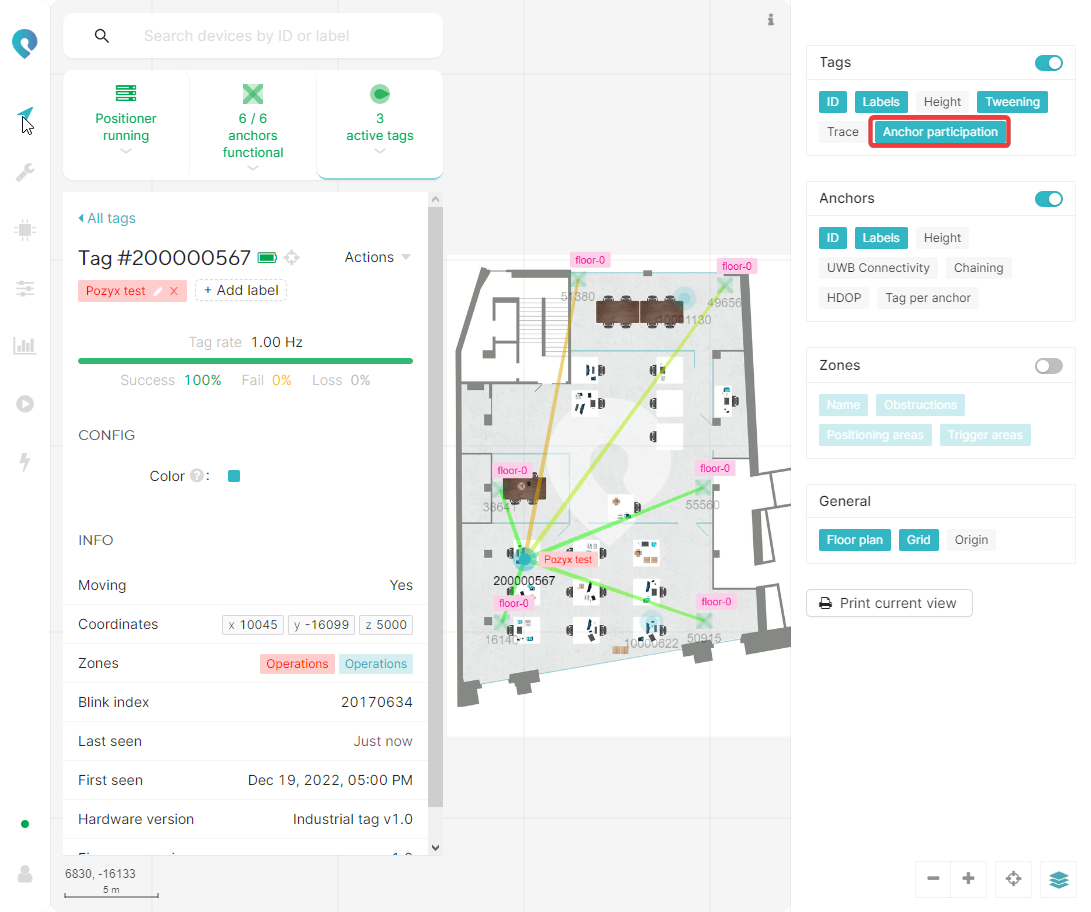
Anchor participation
It can be visualized which anchors are receiving the UWB blinks of a tag with the Anchor participation layer. Selecting a tag on the visualization will show a link to each anchor that receives the blinks. The color of the link is based on the RSS between anchor and tag from green to red. Green indicates a very good RSS (anchors nearby in good LOS) while red indicates a bad RSS (far away anchors or anchors without LOS).
Anchors
This group contains all the visualization options for the anchors.
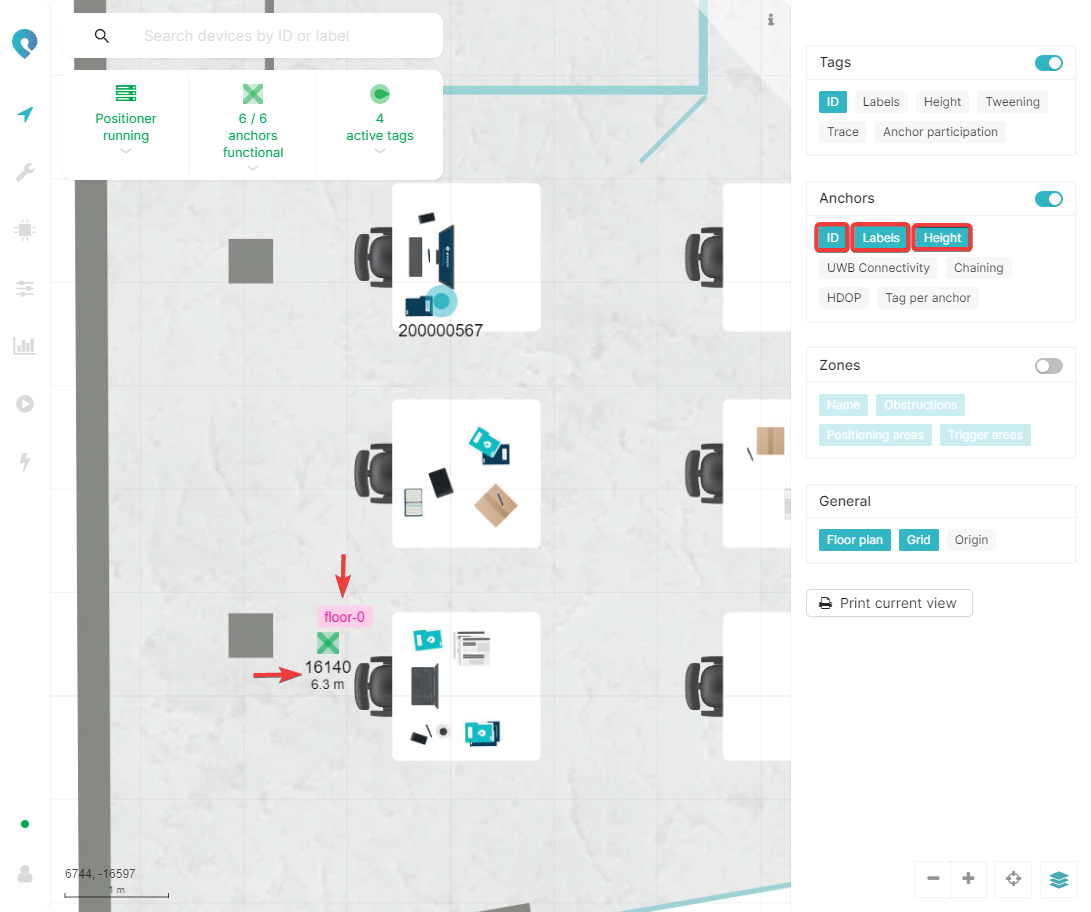
ID, Height and Labels
Similar as for the tags, also the anchor’s ID, height and label(s) can be shown in the visualization.
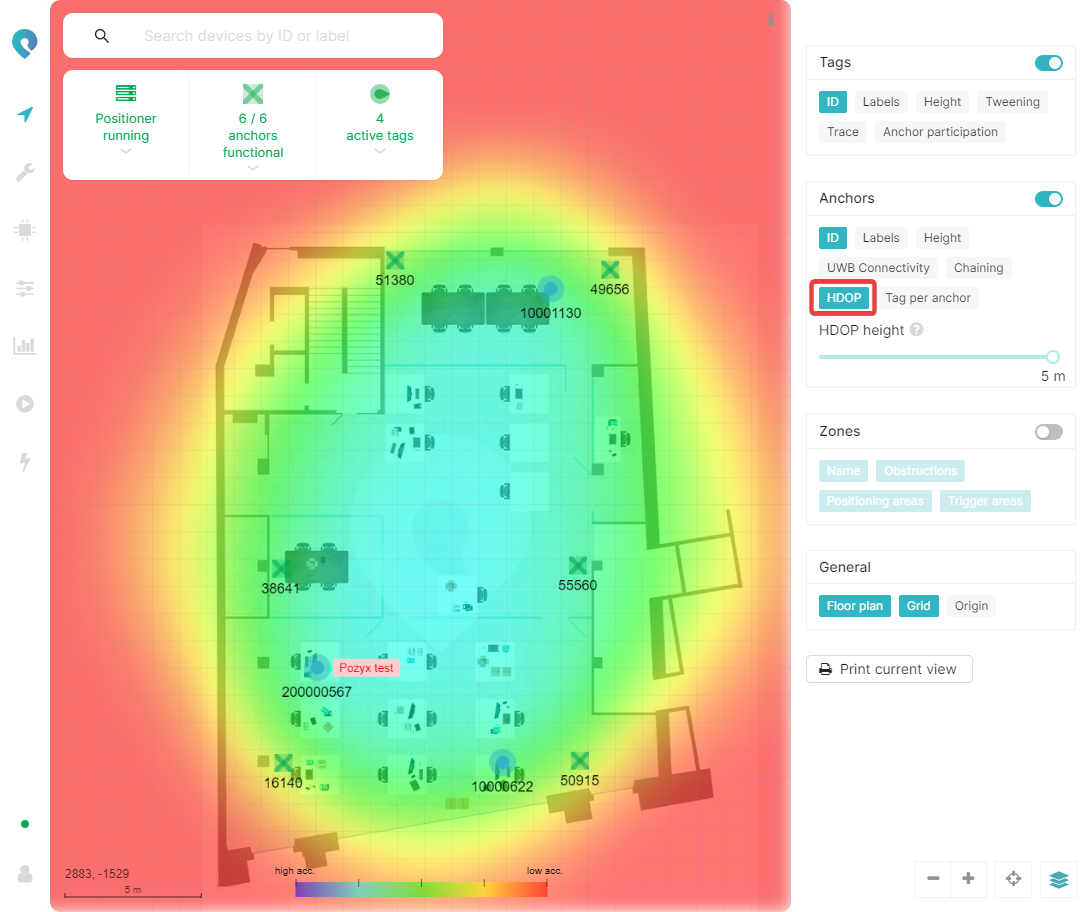
HDOP
The Dilution of Precision (DOP)1 is a measure for the (expected) quality of positions, based on the geometry of the anchors used to compute the positions.
The Horizontal Dilution of Precision (HDOP) shows you the quality of positions you can expect in the xy-plane at a certain height. The height for which the HDOP is shown can be controlled with the HDOP height slider:
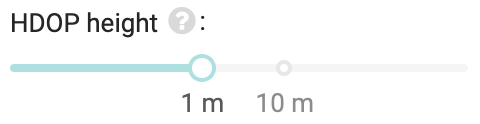
If you have a 2.5D system, then you will be able to set the HDOP height to the heights of your tags as specified in your positioning profiles. E.g. if you have:
A positioning profile with dimension 2.5D and tag height set to 1000 mm
A positioning profile with dimension 2.5D and tag height set to 10000 mm
Then the HDOP height slider will look like the one below and you will only be able to set the HDOP height to 1 m and 10 m.
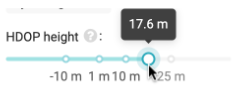
If you have a 3D system, or a mixed system (2.5D and 3D), then you will be able to freely set the height. The heights specified in your 2.5D positioning profiles, and the min and max heights specified in your 3D positioning profiles, will still be shown on the HDOP height slider for ease of use. E.g. if you have:
A positioning profile with dimension 2.5D and tag height set to 1000 mm
A positioning profile with dimension 2.5D and tag height set to 10000 mm
A positioning profile with dimension 3D, min height set to -10000 mm and max height set to 25000 mm
Then the HDOP height slider will look like the one below and you will be able to set the HDOP height to anything.
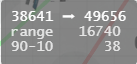
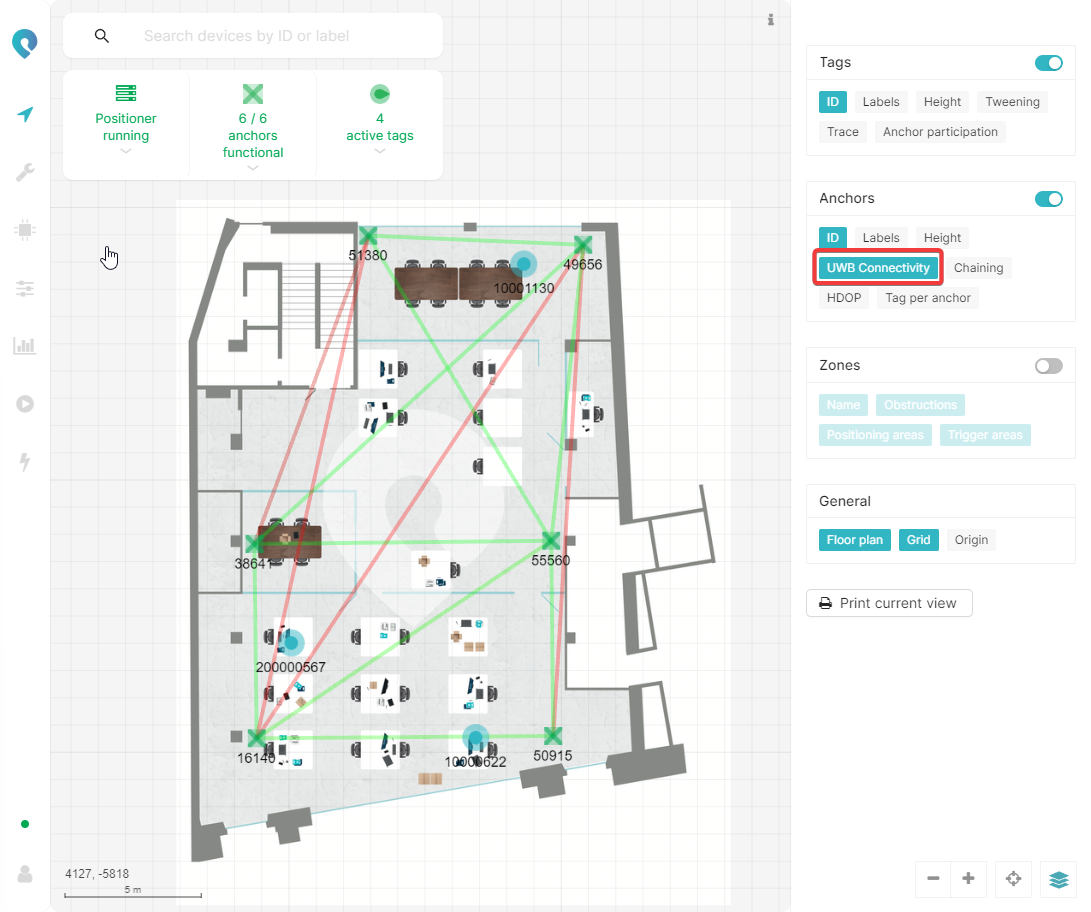
UWB connectivity
The UWB connectivity visualizes the quality of the UWB connection between the different anchors. The color is based on the variance of the ranges between the anchors. A green color indicates a consistent link (good LOS), a red color indicates a variable link (bad LOS) between the anchors. While hovering over the link, the determined range between the anchors is shown as well as the variance on the measurements (between 10th and 90th percentile).
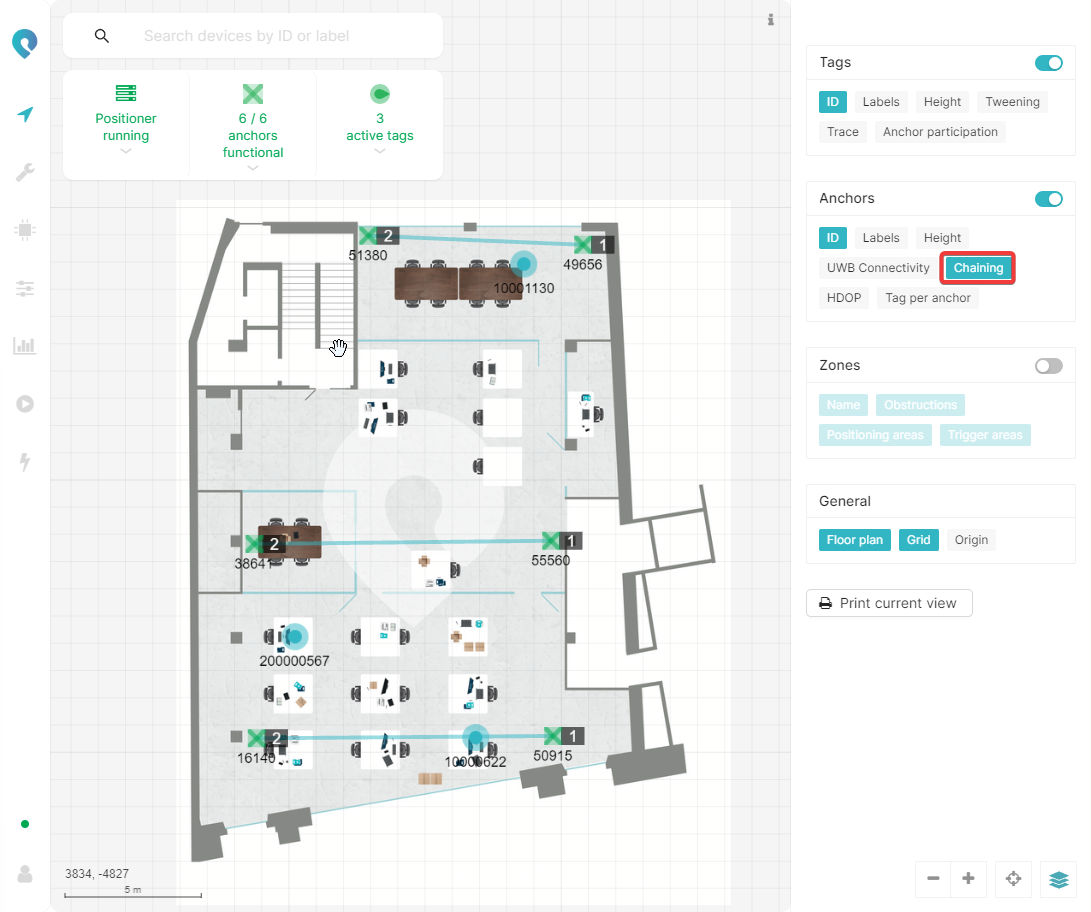
Chaining
The chaining visualizes which anchors are physically connected to each other and in which order.
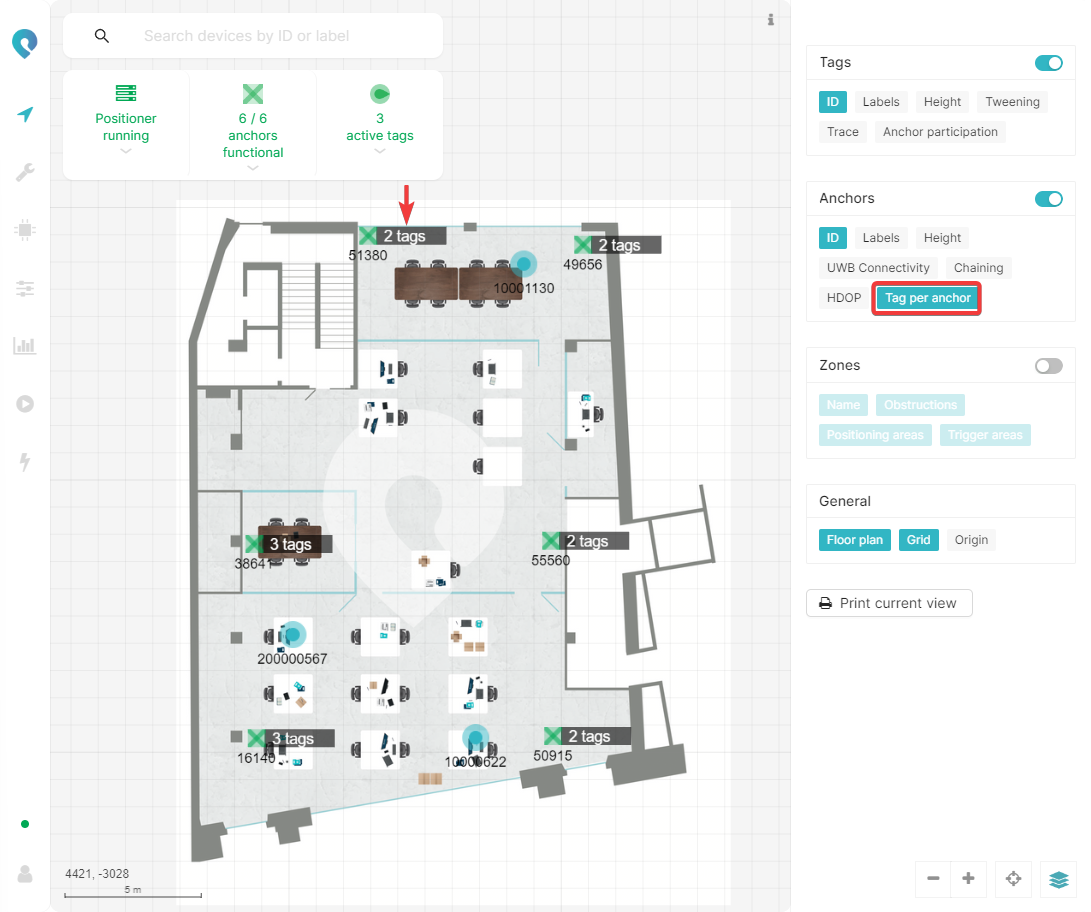
Tag per anchor
The Tag per anchor layer shows for each anchor the amount of tags from which they are receiving blinks.
Zones
This group contains all the visualization options related to zones.
Name
This layer shows the names for all the zones that are visualized. Names for areas that are not visualized will not be displayed.

Obstructions, Positioning areas and Trigger areas
These layers visualize the obstruction, positioning and trigger zones respectively. Each zone is displayed in the chosen color.
General
This group contains all the visualization options for the anchors.
Floor plan
This layer can be toggled to show or hide the floor plan.
Grid
This layer can be toggled to show or hide the rectangular grid.
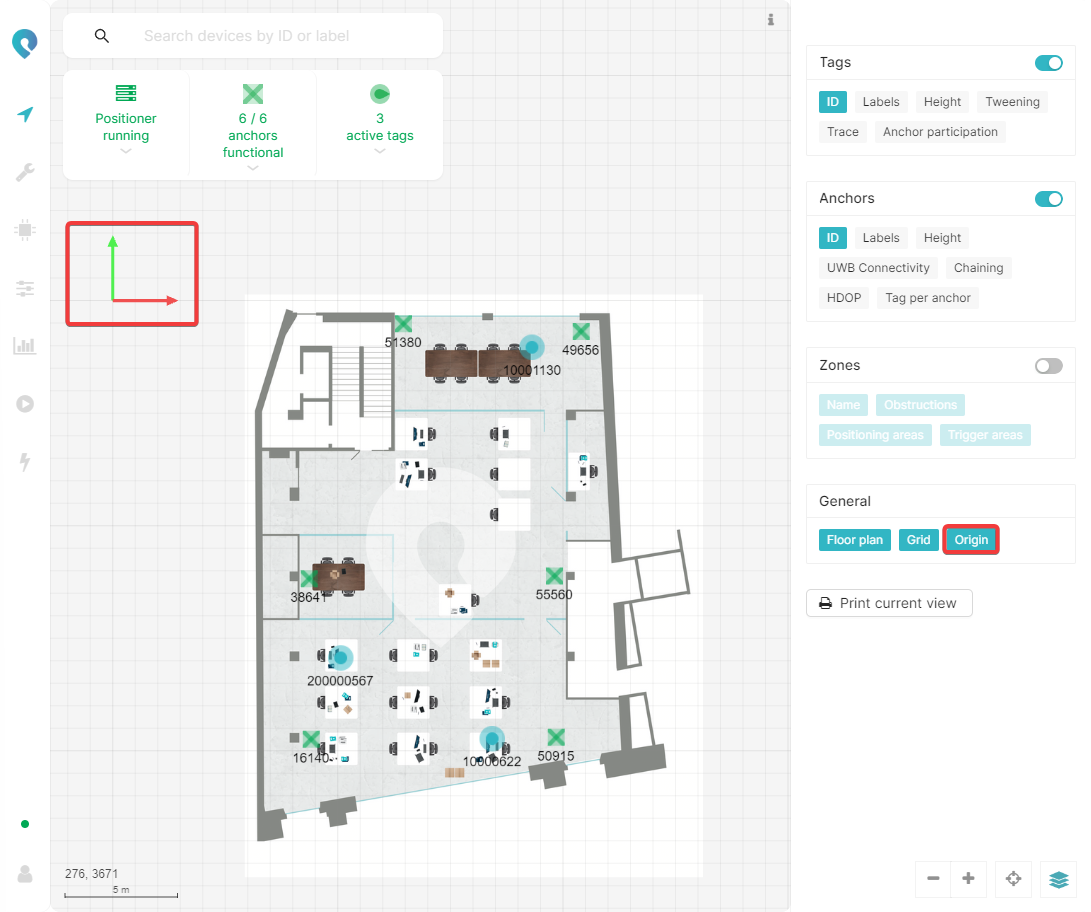
Origin
This layer can be enabled to show the chosen origin point and the x-axis (red) and y-axis (green) direction.
1 More info about DOP: https://www.youtube.com/watch?v=h1jXqTRto1Q. This lecture talks about the DOP in GPS systems, but it is also applicable for the Pozyx system by replacing GPS satellites with anchors.