Devices
Under the Search bar there are 3 buttons showing you the current status of your 3 hardware components: Your positioning server, your anchors, and your tags.
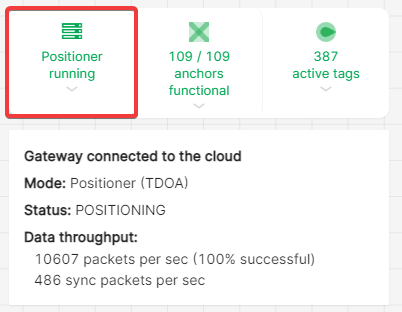
Positioning server
The first button has info about your positioning server. It will tell you:
Whether it is connected to the cloud or not
Which mode it is in (Positioner or Simulator) and which positioning protocol it is running (TDOA)
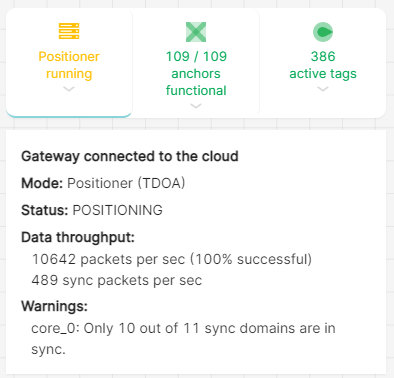
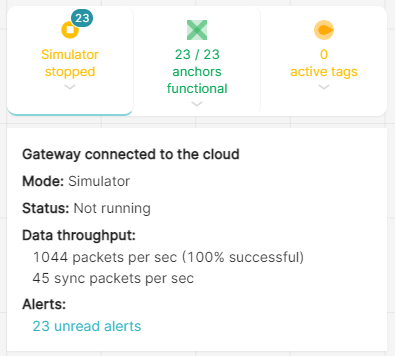
The current status: “Positioning” when everything is fine and “Not running” when there is nothing happening. It could also show you warnings or errors
The data throughput of the system, this can be useful for debugging purposes.
Whether there are unread alerts
Below some examples:
Anchors
The second button shows you the status of your anchors. Clicking on it will open a list of all your anchors and their warnings:
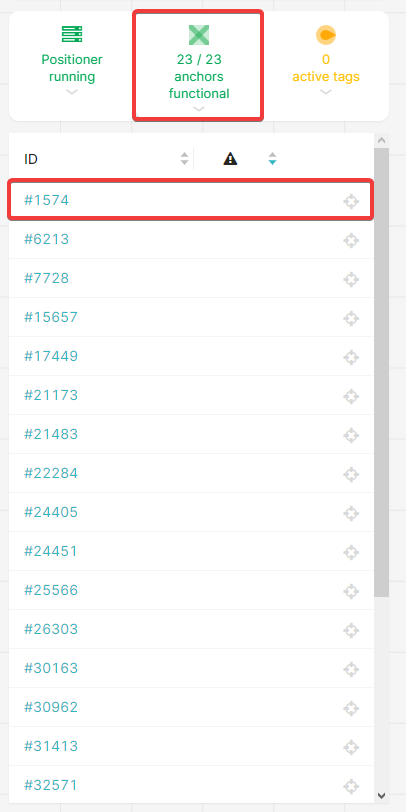
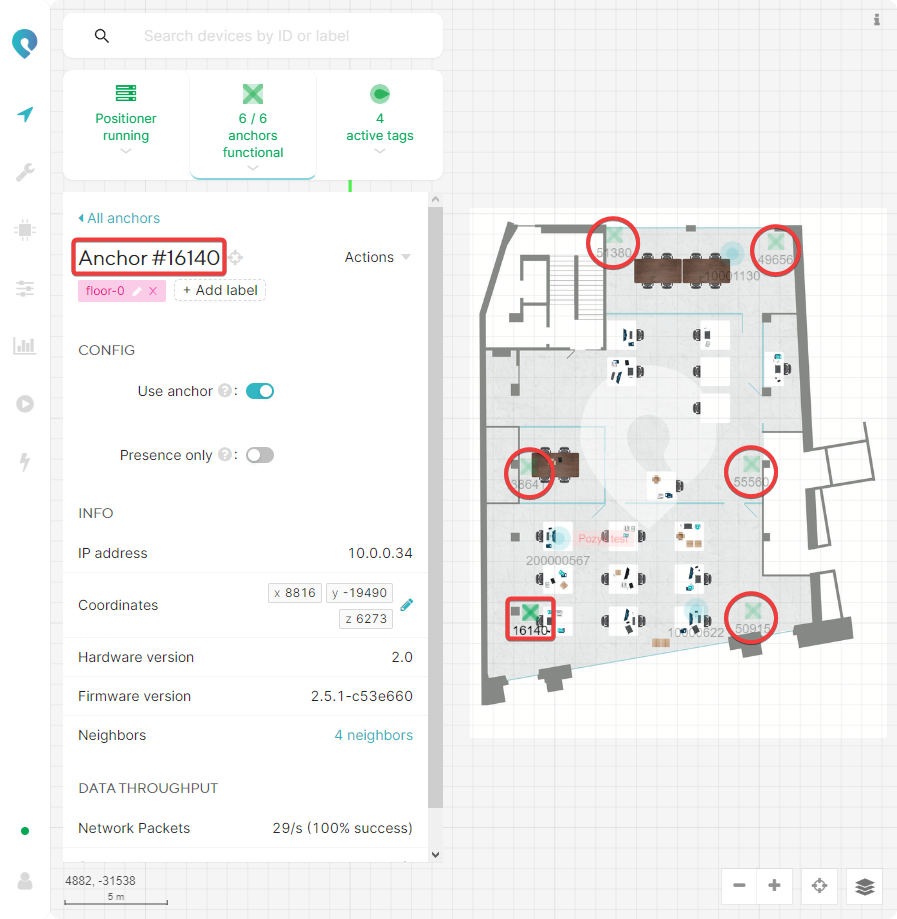
Clicking on an ID will give you more info about that anchor

The configuration, either the anchor is enabled or disabled and the anchor is used for positioning or presence only
IP address
Anchor coordinates
Hardware version
Firmware version
Neighbor information (number of neighbors and measured range to those neighbors)
Data throughput (network and sync packets)
The selected anchor will also be highlighted on the visualization while other devices will be shown less bright:
Warnings and Errors
From the visualization and anchor list you'll quickly be able to spot quirks with your anchors. Anchors with a warning will be shown in orange, and anchors with an error will be shown in red.
The full list of anchor warnings & errors can be found here: Anchor warnings & errors
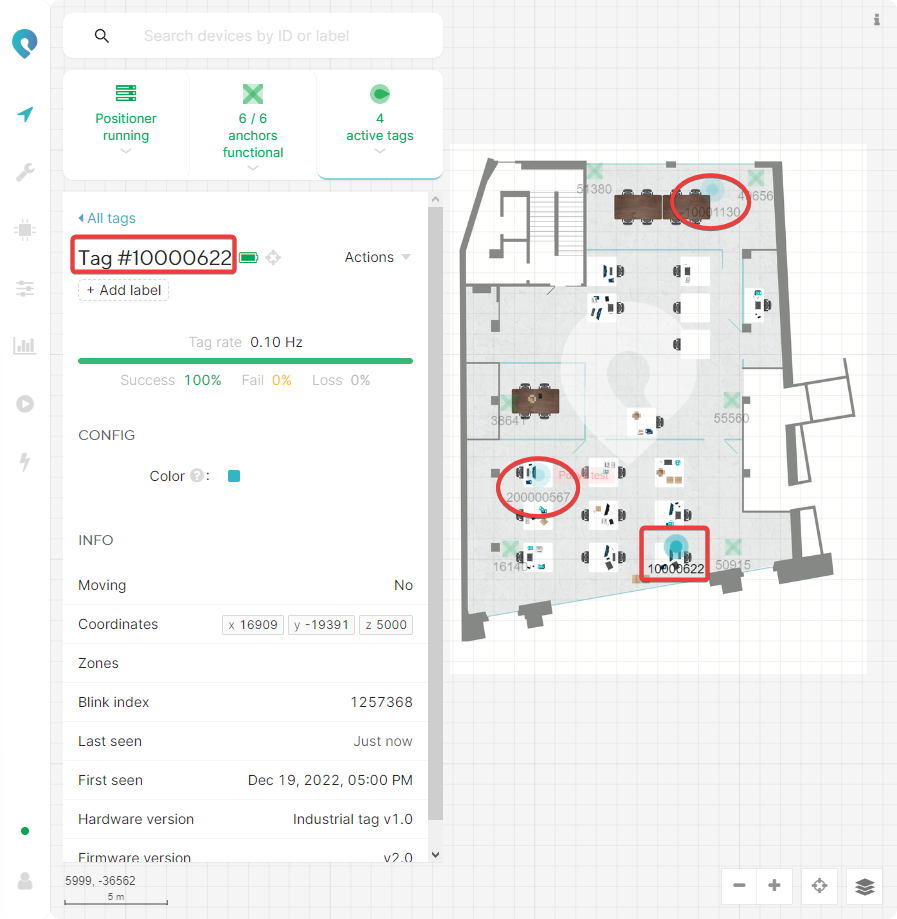
Tags
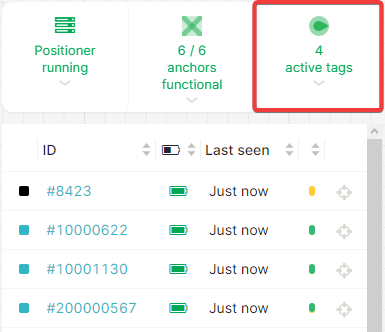
The third button shows you the status of your tags. Clicking on it will open a list of all your tags and show you for each tag when it was last positioned, the battery level and its positioning success rate. This is shown by the little bar charts in column 4. Hovering over these will give you the exact percentages and the reason why not 100% of them are successful. It’s also completely normal that you don’t have a 100% success rate. Anywhere above 80% is good.
Each ID is also clickable to provide more information about that tag. You can see all info below:
The tag update rate
A more detailed bar chart about the positioning success rate
Whether it is moving or static
The current coordinates
The blink index, this value is the amount of messages the tag has send up until this point
When the tag was first and last seen in the setup
Tag hardware version
Tag firmware version
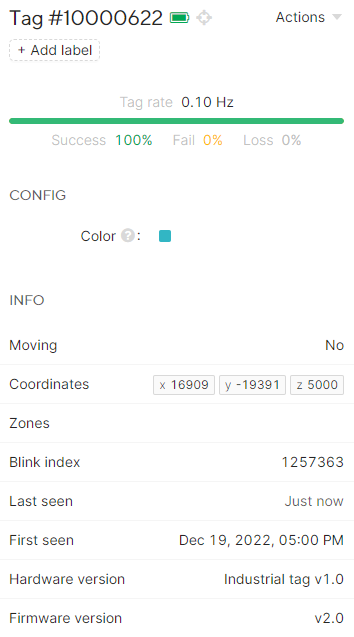
From here you can also edit the label and color of the tag. The selected tag will be highlighted, and other devices will be shown less bright: